Ultraprocessed foods and children's brains: what the data show
A 2026 brain-imaging study found smaller volume in deep brain regions among children with high ultraprocessed food intake, and nationwide US data show it already fills a big share of the average American child's plate.
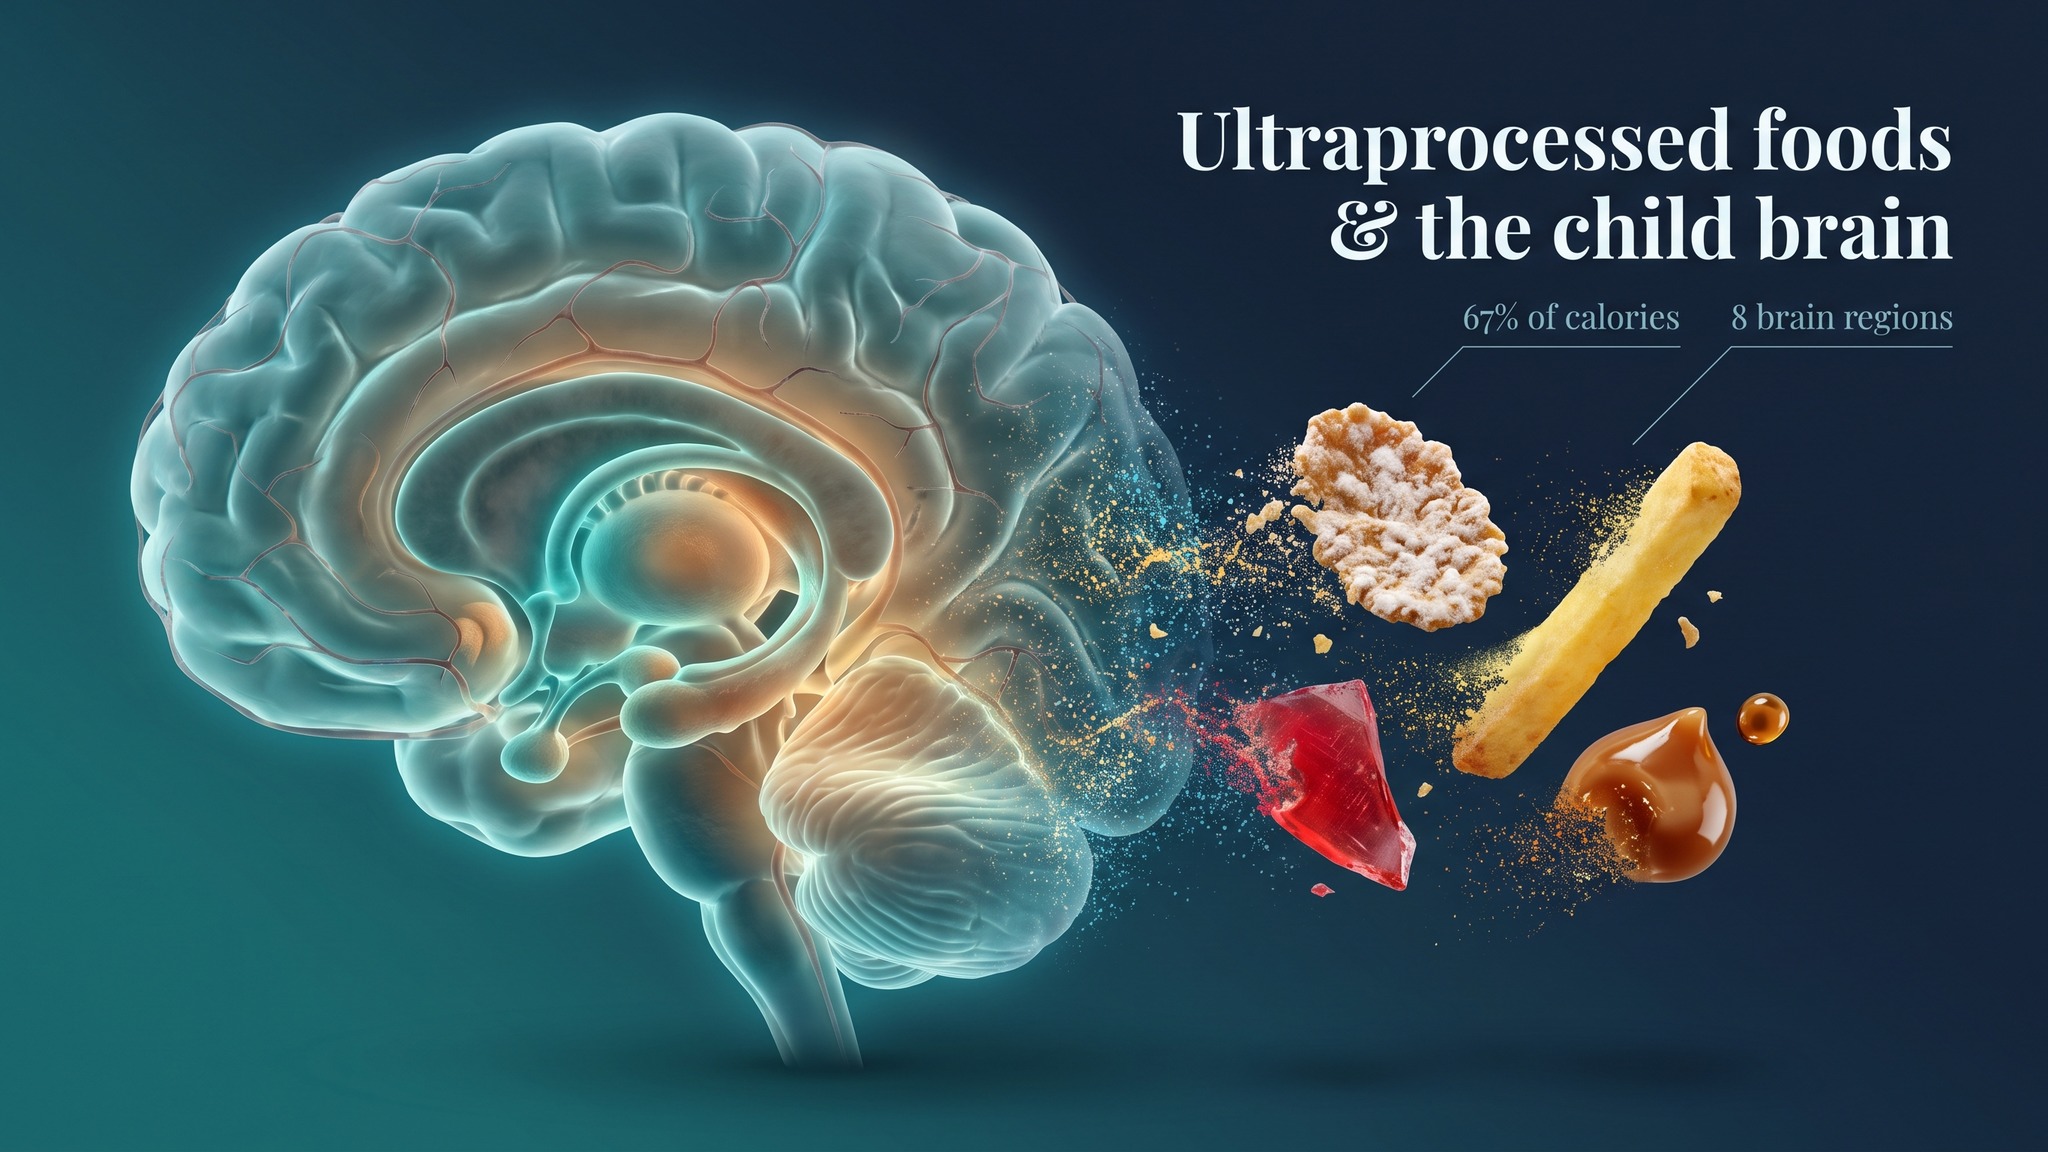
What is the link between ultraprocessed foods and children's brains?
The link between ultraprocessed foods and children's brains goes beyond obvious junk food: the study behind it found the association across every type of ultraprocessed product, including the breakfast cereal a family treats as a safe choice. Researchers at Children's Hospital Los Angeles followed children from infancy to age 6 and published their findings in 2026.
Ultraprocessed foods are products built mainly from refined ingredients, sugar, fats and additives, with little whole food left inside them. The category covers ready meals, sweetened cereals, salty snacks and sugary drinks, and it also covers many foods that look wholesome, such as sandwich bread or supermarket oat cookies.
STUDY Children with higher cumulative ultraprocessed food intake from infancy carried smaller volume in deep brain regions at age 6, with no matching difference in cognitive testing. Ottino-González et al., 2026, American Journal of Clinical Nutrition.
Important: the study shows a statistical association between high ultraprocessed intake and smaller volume in specific brain regions, the kind of population-level pattern that motivates deeper mechanistic research.
How was the study that followed children from 6 months to 6 years designed?
The study followed 144 Latino and Hispanic families in Southern California, from birth through age 6. Researchers logged diet with repeated 24-hour recalls at 6, 12, 24 and 72 months, to calculate the share of calories coming from ultraprocessed foods at each stage.
Children completed cognitive testing at ages 2 and 6, and at age 6 they also had a brain MRI, with volume measured across 16 subcortical regions. This pairing, years of dietary data alongside brain imaging, is rare at such young ages.
144 families
Latino and Hispanic mothers and infants from Southern California, followed through age 6.
4 time points
Diet recorded at 6, 12, 24 and 72 months using 24-hour dietary recalls.
The NOVA system
Every food was classified under NOVA to calculate the percentage of ultraprocessed calories.
Testing at 2 and 6
Cognitive testing at two time points, to check for a possible functional effect.
16 regions at age 6
Brain MRI measuring volume in 16 subcortical structures.
How much does ultraprocessed food intake climb as a child grows?
The climb is steep. Across the full sample, the share of calories from ultraprocessed foods rose from 16.4% at 6 months to 55.5% at 6 years, meaning more than half of a child's plate eventually came from this single food category.
The steepest jump, 21.2 percentage points, landed between 24 and 72 months, exactly when a child moves into more regular, family-style meals. This window between ages 2 and 6 looks like the critical stretch for the eating habits a child carries forward.
Percentage of calories from ultraprocessed foods by age
Estimated marginal means, linear mixed model, sample of 144 families. Ottino-González et al., 2026, American Journal of Clinical Nutrition, Figure 1. (The 12-month value is not shown in the published figure; the point is interpolated here for a smooth line, not presented as a reported statistic.)
How much ultraprocessed food do American children eat today?
A lot. Nationally representative NHANES data show that ultraprocessed foods supplied 67% of the total daily energy US children and teenagers consumed in the most recent cycle analyzed, meaning close to two out of every three calories a child eats now come from this single category, a scale that keeps the conversation about ultraprocessed foods and children's brains directly relevant to American families.
That share climbed steadily over two decades, from 61.4% in 1999-2000 to 67.0% in 2017-2018, and the rise landed hardest among non-Hispanic Black youths (62.2% to 72.5%) and Mexican American youths (55.8% to 63.5%), compared with non-Hispanic White youths (63.4% to 68.6%).
STUDY Among 33,795 US youths aged 2-19 years tracked across ten NHANES cycles, the estimated share of total energy from ultraprocessed foods climbed from 61.4% to 67.0% between 1999 and 2018. Wang et al., 2021, JAMA.
Share of daily calories from ultraprocessed foods in US children
US youths aged 2-19 years, NHANES 1999-2018 (10 cycles), n=33,795. Wang et al., 2021, JAMA, doi 10.1001/jama.2021.10238.
A companion national analysis links that climb directly to diet quality. Children in the group with the lowest ultraprocessed intake had a 31.3% rate of poor diet quality, while children in the group with the highest intake, above 79% of energy from ultraprocessed foods, reached a 71.6% rate.
STUDY Among US children, the estimated proportion with poor diet quality rose from 31.3% in the lowest quintile of ultraprocessed intake to 71.6% in the highest quintile. Liu et al., 2022, American Journal of Preventive Medicine.
Which food categories add the most ultraprocessed calories to an American child's plate?
Four categories. Ready-to-heat and ready-to-eat meals, sweet snacks and bakery sweets, sugar-sweetened drinks, and processed fats, oils, condiments and sauces together supply about half of all the ultraprocessed calories American children eat, according to the same nationwide NHANES analysis.
Ready-to-heat and ready-to-eat meals climbed the fastest of any subgroup, from 2.2% to 11.2% of total energy between 1999 and 2018, and sweet snacks and sweets, a group that includes cakes, cookies, pies and pastries, grew from 10.7% to 12.9%. Sugar-sweetened drinks moved the other way, falling from 10.8% to 5.3% of total energy over the same two decades, and processed fats, oils, condiments and sauces slid from 7.1% to 4.0%.
Share of ultraprocessed calories by category in US children
Recalculated as a share of total ultraprocessed calories from each subgroup's percentage of total energy intake (subgroup % ÷ 67.0% total ultraprocessed share). US youths aged 2-19 years, NHANES 2017-2018 cycle. Wang et al., 2021, JAMA, doi 10.1001/jama.2021.10238.
Ready-to-heat meals and sweet bakery items now carry more weight in an American child's ultraprocessed intake than sugary drinks do, a reversal from the soda-heavy pattern many people still picture when they hear the term.
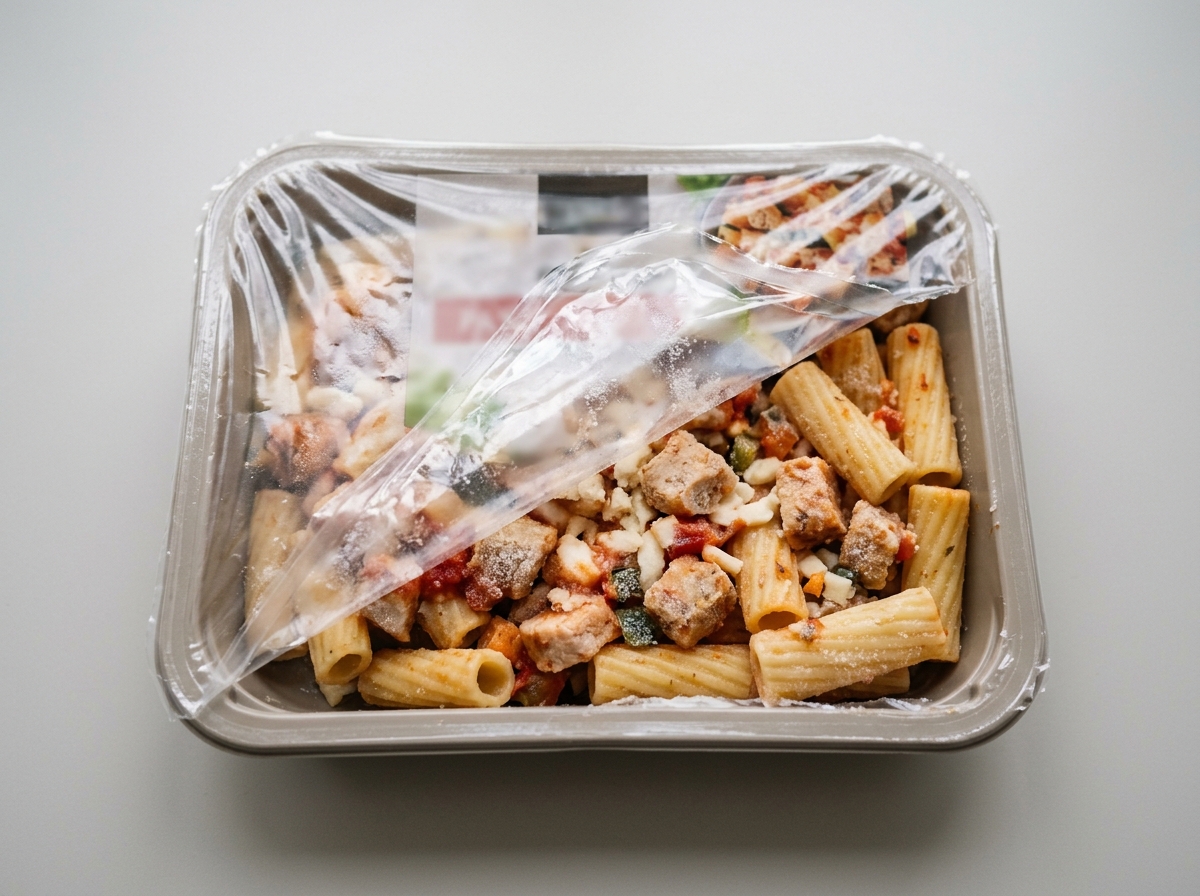
Ready-to-heat meals
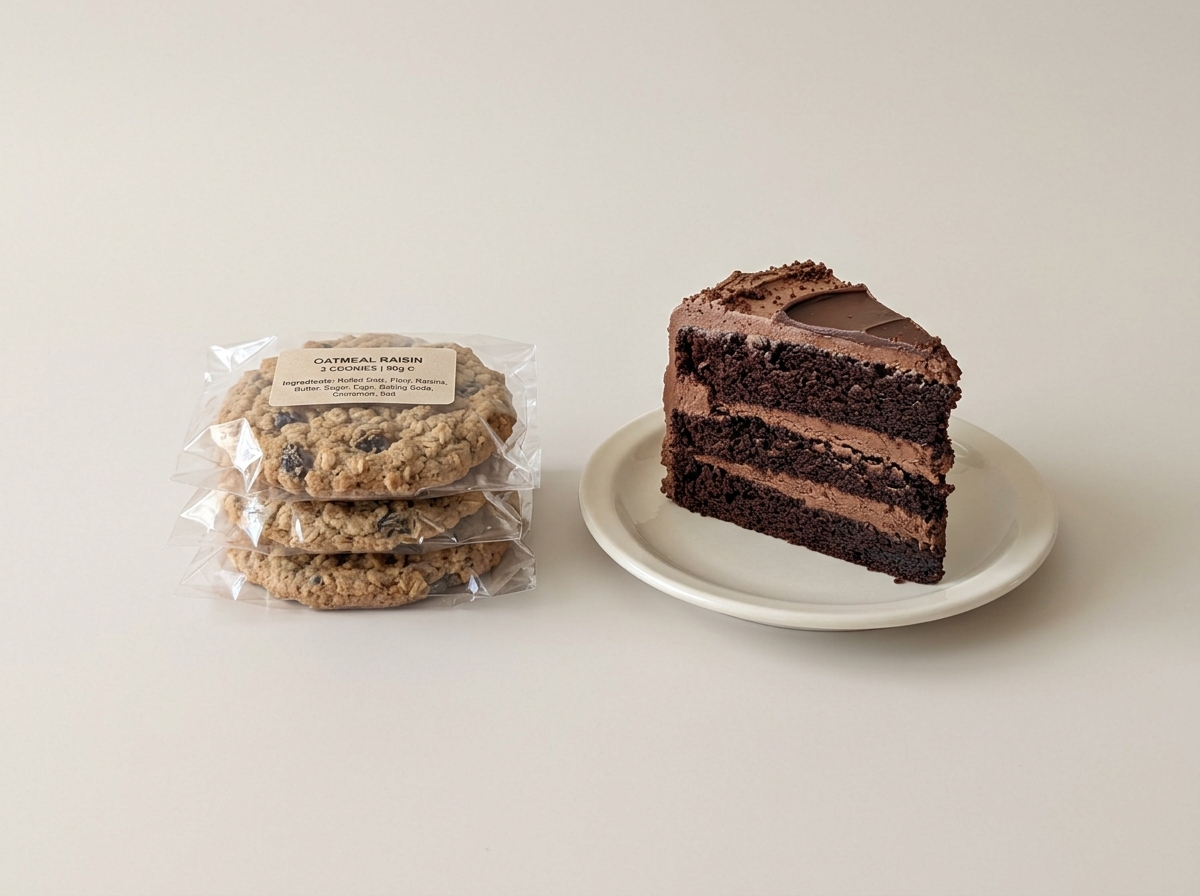
Sweet snacks and sweets

Sugar-sweetened drinks
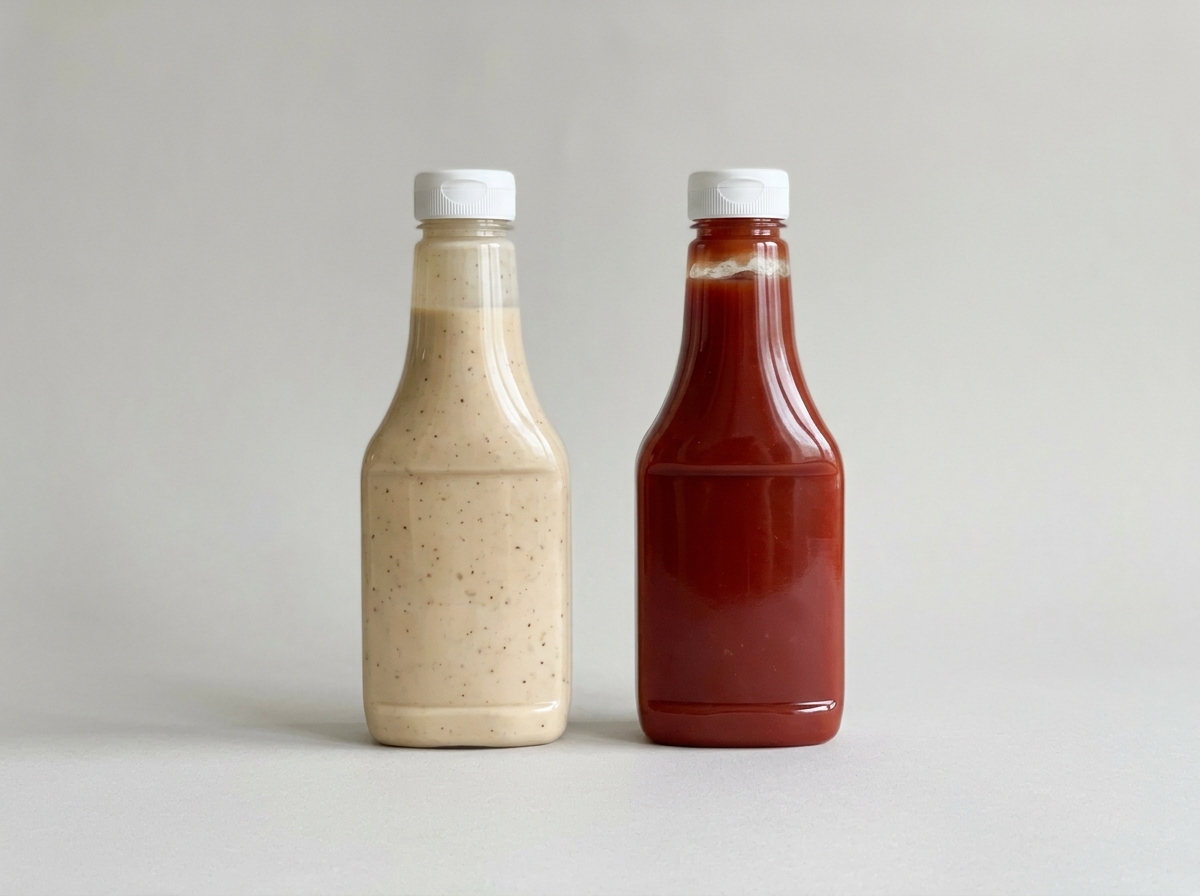
Fats, oils, condiments and sauces
Which brain regions were smaller in children with high intake?
Eight regions, all deep inside the brain. Researchers identified statistically smaller volume, after correction for multiple comparisons, in the accumbens, amygdala, pallidum, putamen and thalamus, bilaterally in several of these structures.
These regions are far from random: they govern reward, emotion, movement and the relay of sensory signals, a large share of how a child feels pleasure, manages mood and stays focused.
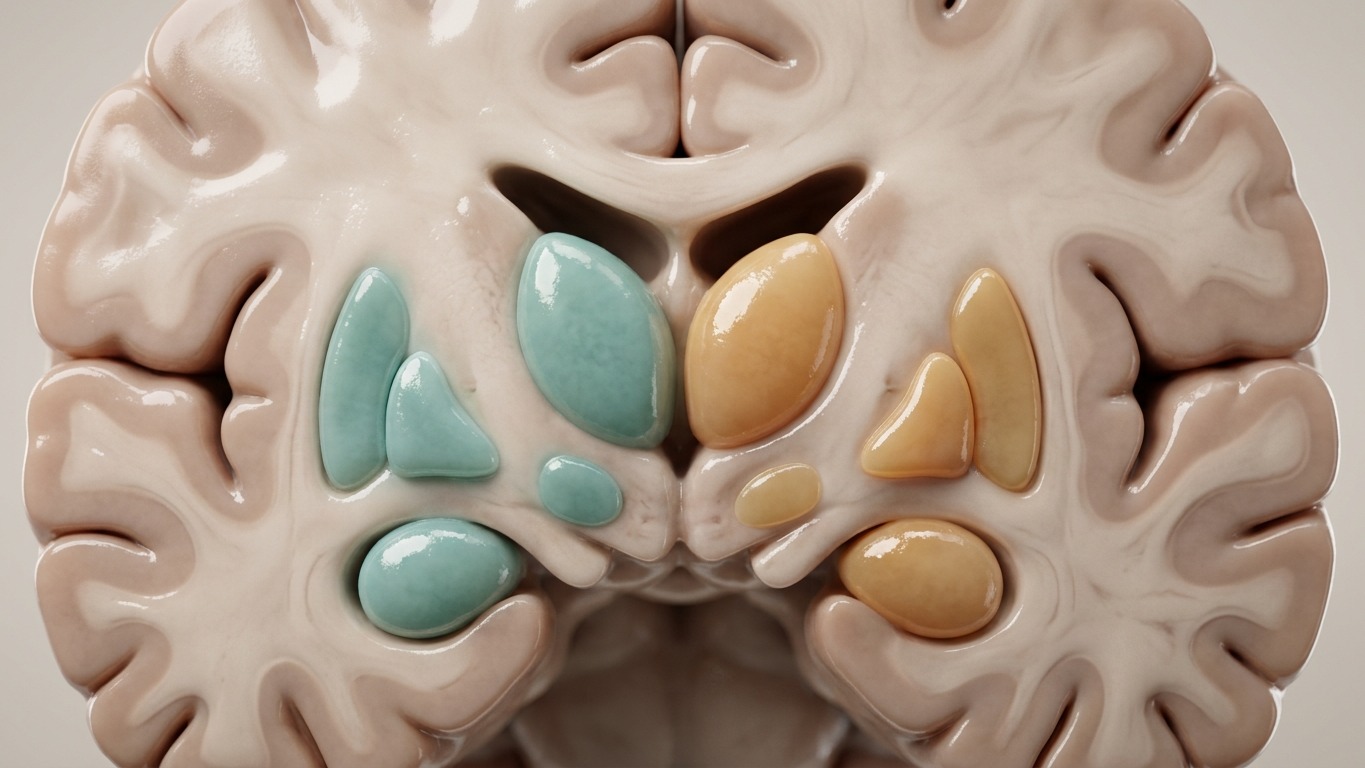
Volume change per unit increase in ultraprocessed intake
Standardized β per unit increase in ultraprocessed share, with 95% CI, all FDR-corrected P<0.05. Ottino-González et al., 2026, American Journal of Clinical Nutrition, Table 2.
How much smaller was brain volume in the highest-intake children?
Considerably smaller. Children in the highest consumption quartile, with 62% or more of calories from ultraprocessed foods, carried up to 8.3% smaller volume on average in specific regions compared with children in the lowest quartile, at 31% or less.
The relationship tracked with dose: each additional 10% of ultraprocessed foods in the diet lined up with roughly 1.9% smaller volume, and that trend held steady across the full range of consumption.
Volume difference, highest vs lowest consumption quartile
Adjusted % volume difference, highest vs lowest consumption quartile (62% or more vs 31% or less of calories from ultraprocessed foods). Ottino-González et al., 2026, American Journal of Clinical Nutrition.
How can a sweet or salty snack affect the brain's reward circuit?
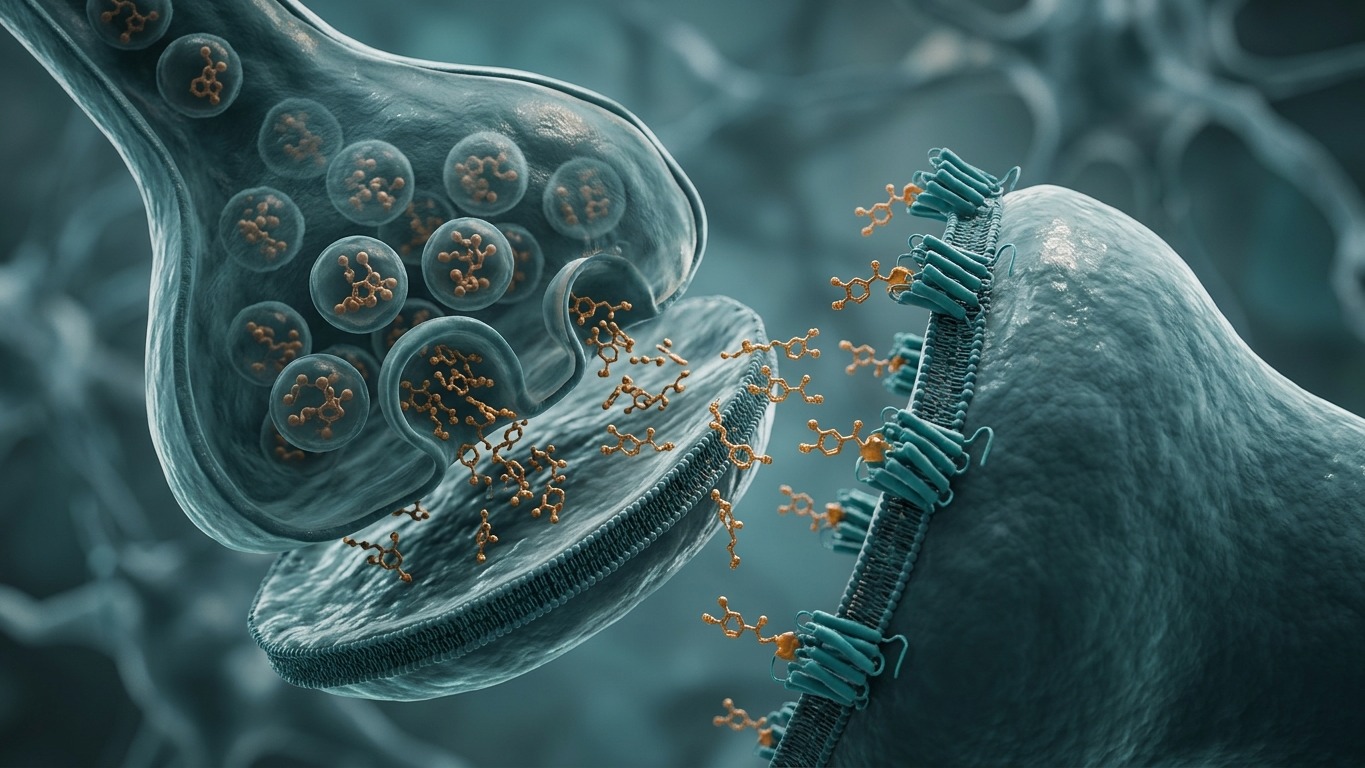
Through dopamine. Very sweet or fatty foods strongly activate the brain's reward circuit in humans, releasing dopamine in the striatum every time they are eaten.
In animal studies, repeated exposure to these foods reduced striatal D2 dopamine receptors. In practical terms, the reward circuit grows less sensitive over time and calls for a stronger stimulus to reach the same satisfaction.
What's really inside a box of sweetened breakfast cereal?
More than sugar. A typical box of sweetened breakfast cereal, among the most common ultraprocessed products on the American breakfast table, usually contains added sugar, emulsifiers, and sometimes artificial sweeteners and food dyes. Each ingredient carries a different level of evidence for its possible effect on the brain.
Added sugar carries the strongest documented footprint, backed by data from humans and animals alike. Emulsifiers and artificial sweeteners are backed mainly by in vitro data, meaning cell-culture studies, well ahead of large clinical trials in children.
| Ingredient | What the data show |
|---|---|
| Added sugar | Strongly activates the reward circuit and lowers D2 dopamine receptor sensitivity, documented in both human and animal studies. |
| Emulsifiers (e.g. carboxymethylcellulose) | Linked with gut microbiome disruption and a pro-inflammatory signal, documented mainly in vitro and in animal models. |
| Artificial sweeteners (e.g. sucralose) | At high doses, activates microglia and links with neuroinflammation, documented mainly in vitro at high dose. |
| Dyes and artificial flavors | Function mainly as a marker of processing level under the NOVA system, with more limited direct brain data. |
What do these brain regions control, and what does other research show?
A great deal, and none of it by accident. The accumbens sits at the center of the reward circuit, activated by pleasurable cues such as food. The amygdala processes emotion and emotional memory, important for mood regulation. The pallidum and putamen participate in movement, motivation and reward-based learning, while the thalamus works as the central relay station carrying information toward the cortex.
Accumbens
Central node of the reward circuit, activated by pleasurable stimuli such as food.
Amygdala
Processes emotion and emotional memory, important for mood regulation.
Pallidum and putamen
Participate in movement, motivation and learning through reward.
Thalamus
Works as the central relay station carrying sensory information to the cortex.
STUDY A systematic review of 35 studies covering more than 84,000 children and adolescents linked higher ultraprocessed intake with weaker attention and executive function. Nguyen et al., 2025, Food Frontiers.
Why did cognitive test scores stay similar even as brain structure changed?
Structural change likely comes first, ahead of any functional change. Even though eight regions showed smaller volume, cognitive testing at ages 2 and 6 showed comparable performance across children with high and low intake.
Researchers read this as an early stage, where structure shifts first, while function may show an effect later, or at a larger scale of exposure. A child can perform at a typical level today, while the brain already carries measurable structural change.
- 1
Today: structural change
Smaller volume across eight subcortical regions, measurable on MRI at age 6.
- 2
Later: a possible functional effect
Long-term studies can show whether, when and to what degree this structural difference translates into behavior or cognition over time.
What can you change in your child's breakfast and snacks?
Three steady changes to the everyday breakfast and snack routine carry more practical weight than a strict, short-lived diet.
Start with the meal that repeats every single day, breakfast, since that is where a change carries the largest cumulative effect on total ultraprocessed exposure over time. A related question worth asking is which everyday foods actually support the gut microbiome, since breakfast is where that swap is easiest to make.
- Swap sweetened breakfast cereal for oatmeal or bulgur with fresh fruit
- Trade deli-meat toast for whole-grain bread with egg or cheese
- Trade a packaged cereal bar for fruit with a handful of nuts
Many of these swaps line up naturally with a Mediterranean-style eating pattern, which makes them easier to sustain past the first week.
Curious what your child is really eating?
If you want a clear picture of your child's actual ultraprocessed exposure, let's look at it together.

IBSyncrasy
If you want to understand how diet biochemistry shapes the body in depth, IBSyncrasy is a solid guide to start with.
Buy IBSyncrasyFrequently asked questions
The study shows an association between high ultraprocessed intake and smaller volume in specific brain regions, with no matching difference in cognitive testing between higher- and lower-intake children, a pattern that calls for careful interpretation and further research on mechanism.
Four categories carry the most weight: ready-to-heat meals, sweet snacks and bakery sweets, sugar-sweetened drinks and processed condiments, together supplying about half of the ultraprocessed calories in an American child's diet.
A realistic, sustainable swap works well for most days: oatmeal or bulgur with fresh fruit as the everyday breakfast, with sweetened cereal kept for occasional treats.
Researchers read this as an early stage where structural change comes first, meaning a child can perform at a typical level today while carrying measurable structural differences that may show a functional effect later, at a larger scale of exposure, or both.
The window from infancy through age 6 looks especially sensitive, since the brain develops quickly and builds key connections during those years. Later stages carry their own importance too, and the available data point to this early window as the one that counts most.